Unlocking Key Insights for Coaches, High Performance Managers, and Exercise Scientists.
At iNSPIRETEK, we’re dedicated to empowering coaches, high-performance managers, and exercise scientists with the tools they need to drive team success. Our latest feature, the Manager Dashboard Screen, is a game-changer in the world of athlete management. This dashboard serves as a comprehensive insight report, allowing coaches to measure both the activity and engagement levels of their teams more efficiently than before.

Why Did We Build It?
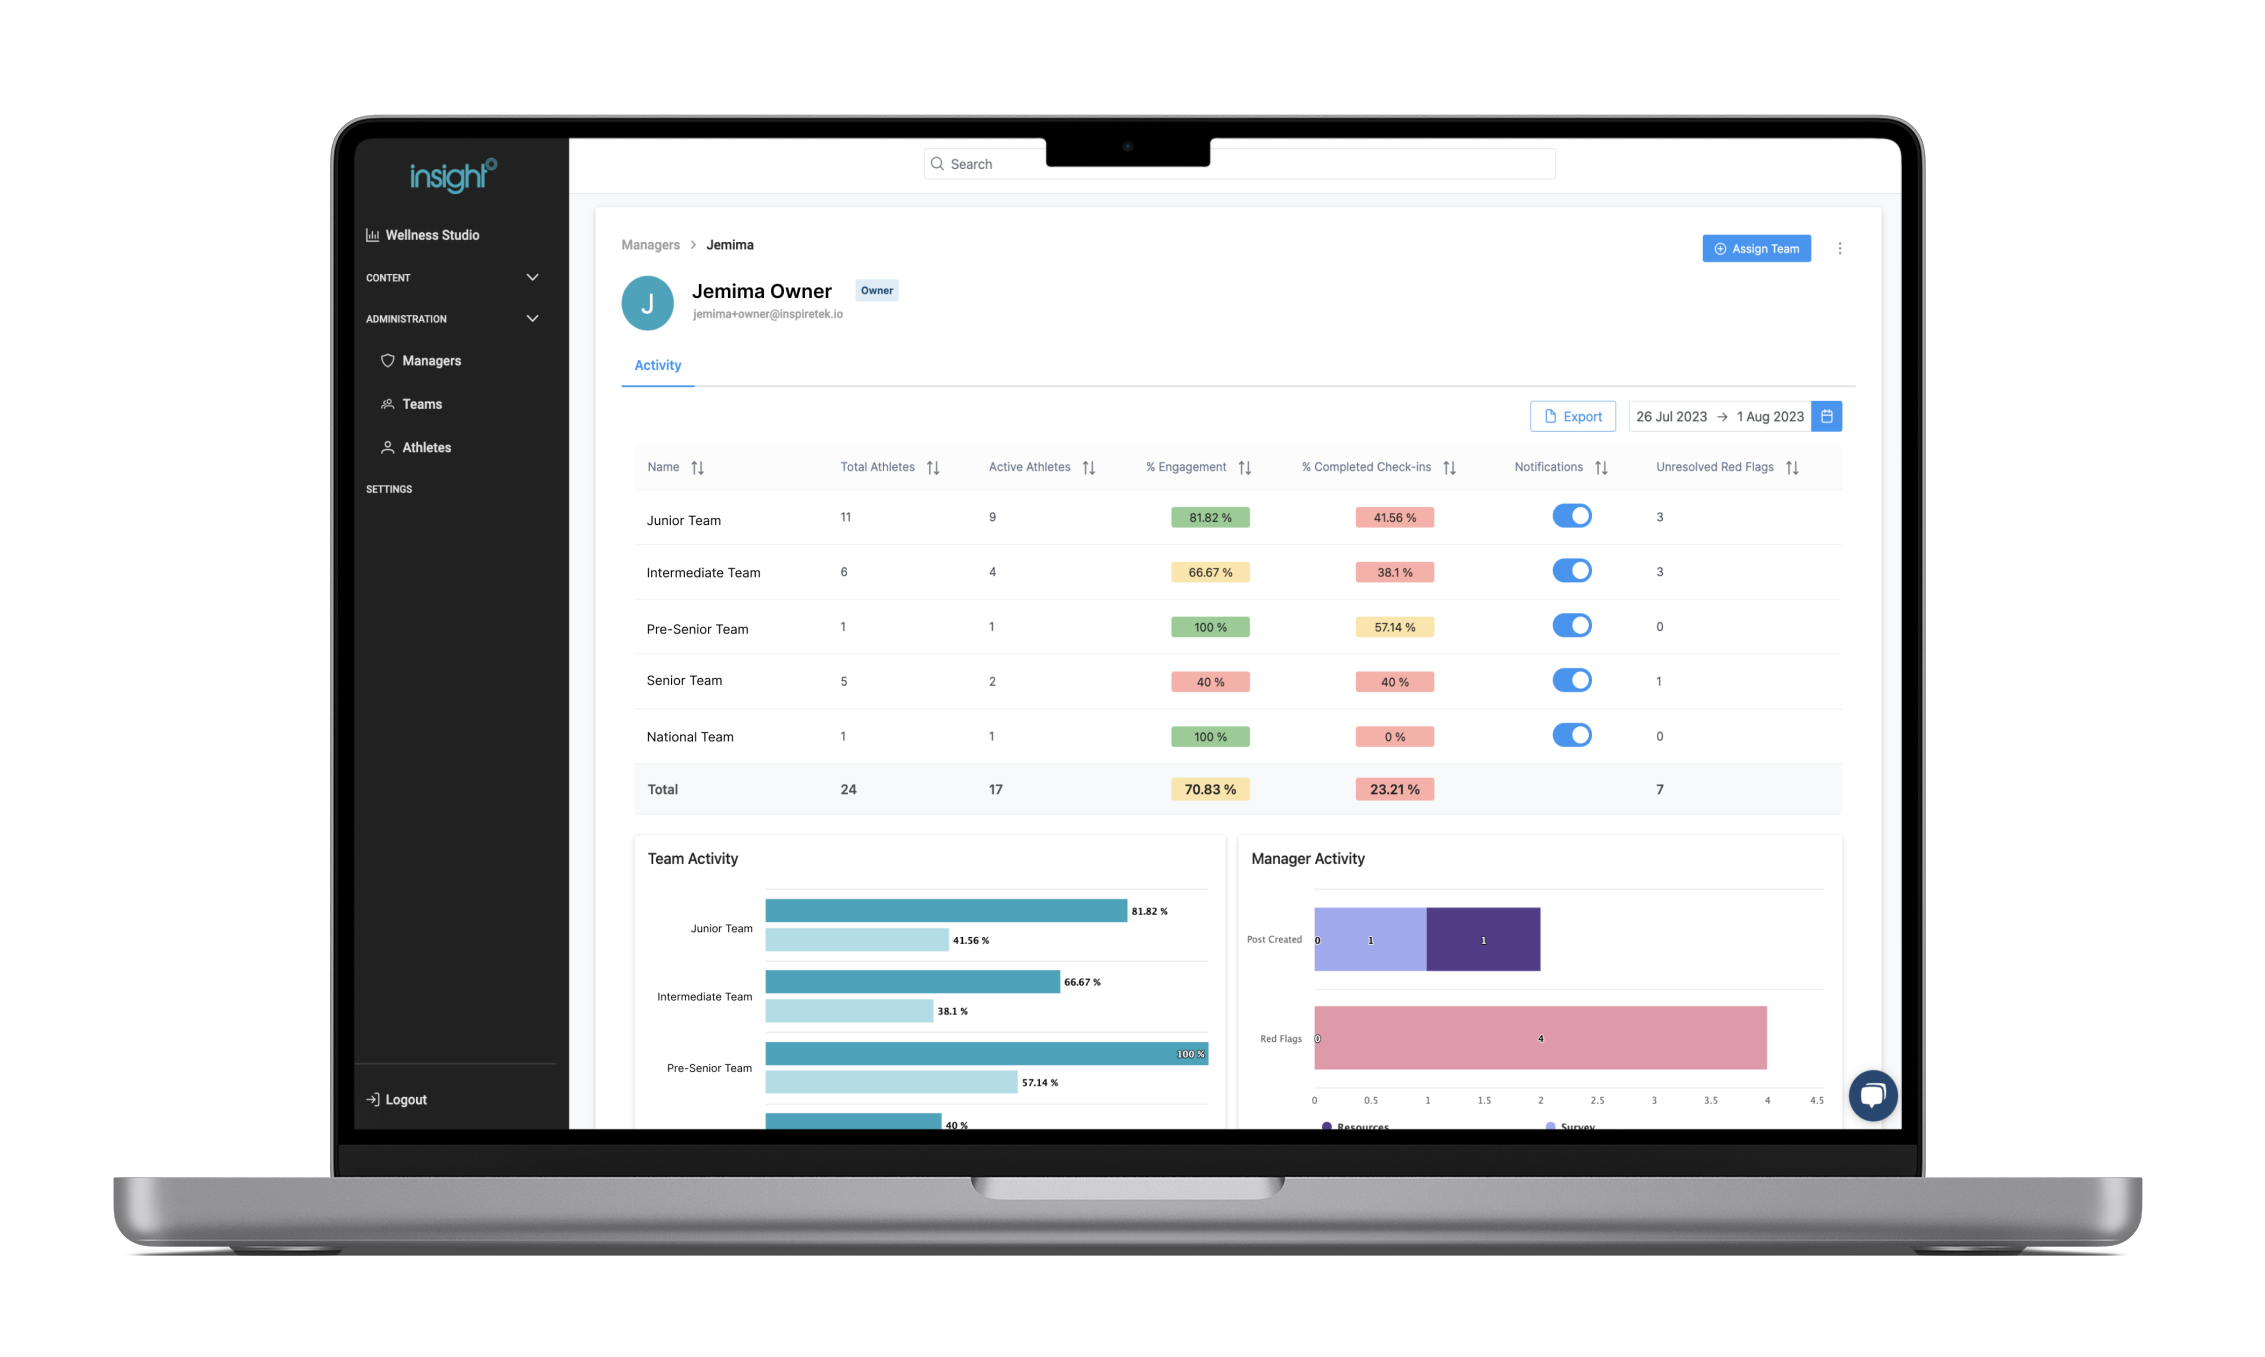
Success is often quantified by data, and we wanted to provide coaches with an effortless way to track and measure that success. The Manager Dashboard Screen is the answer. Picture this: Football QLD sets an ambitious goal of 80% engagement per team. Now, with our dashboard, this data is displayed in a clear and concise layout, showcasing the number of active athletes and their engagement rate. The dashboard becomes a vital tool, offering rela-time insights that can shape coaching strategies and drive performance.
How Does It Work?
Engagement is at the heart of our dashboard. Athletes’ level of engagement is determined by their frequency of data input. The dashboard presents a holistic view:
- Total Athletes: Displays the number of athletes in the team.
- Active Athletes: Shows athletes who’ve completed at least one entry within the chosen date range (default range being the last 7 days).
- Engagement %: This is calculated based on active athletes.
- Completed Check-ins %: Reflects athletes who’ve completed an Infinite Score check-in within the chosen date range.
The dashboard also allows managers to fine-tune email summaries and notifications, empowering them to maintain streamlined communication.
Visualise Insights at a Glance
Our Manager Dashboard Screen takes data visualization to the next level:
- Team Activity Graph: This breakdown showcases engagement % vs. completed check-in % for each team, spotlighting the top-performing teams.
- Manager Activity Graph: This graph segments the number of posts created by managers by post type (resource, survey, text, or image). It also highlights the number of red flags resolved by each manager, offering a comprehensive view of managerial efforts.
Turning Data into Success: Tips for Coaches
Achieving peak engagement isn’t just about numbers; it’s about aligning with your team’s vision of success. Our dashboard is a versatile tool, and here’s how you can make the most of it:
- Define Success Collectively: Schedule sessions with your athletes and staff to collectively define what success means for your team. Decide whether tracking should be a daily practice or limited to training days.
- Focus on Essential Metrics: Identify key metrics that offer meaningful insights and communicate them clearly to your athletes. Setting expectations from the start ensures seamless adoption and continued engagement.
- Build Trust and Recognise Efforts: Foster a healthy relationship around well-being tracking by building trust and offering positive feedback. Recognise your athletes’ dedication and celebrate their commitment to the cause.
- Introduce Friendly Competition: Consider setting up a well-being tracking leaderboard. Sharing weekly rankings through the iNSPIRETEK app sparks friendly competition, inspiring and motivating athletes.
Discover more about iNSPIRETEK’s cutting-edge solutions that redefine athlete management. Contact us today and join us in unlocking the potential of your team.


